 About Us
 Services
 Sectors
 Case Studies
 Blog
Blog Contact
Machine Learning Fun
Date: Monday, February 25, 2019
A January Friday we had a machine learning research day, a team of Village Engineers got together to look at an industrial machine learning problem.
Everybody likes a problem where you can keep score. A group of 9 of us met, including guests, hiding in a basement meeting room to avoid daily distractions. We workshopped it together to try a range of approaches.
A Hartree Centre data scientist Mark Pipe came along to keep us on the Data Science straight and narrow.
I'd prepared a year of shop floor machine speed data for a set of 4 similar machines on the factory floor from our client Prinovis. In this case I provided all the things that are known by the manufacturing system (efi’s Technique) about a job before it hits the shop floor. We already had a lot of business intelligence data on this, including speed calculations and understood the problem, so a good place to start.
On this occasion we were looking at machines that collect magazine parts and staple them. YouTube has a video of a similar machine to get the gist. Below I’ve laid out what we did and discovered, an approach you could use to test a machine learning opportunity.
Getting the Data Together
As we already produce business intelligence for all the shop floor operations for a range of reporting, key performance indicators etc. We had a good starting point. Our client has it all stashed away in SQL Server. I was able, with their permission, to intercept this to take data on our target machines and add some bill of materials data to indicate which bits of machinery the various components have come from. In Business Intelligence we try to present a rich, highly dimensioned set of data for business users to get answers from. But for machine learning we want to prep a flat single file with everything in numbers. Think of a single page of spreadsheet with columns but no text. It took about 10 hours to write the code to pull out suitable summaries of the data, and about 5 hours for the servers to compile millions of production records into a three thousand row summary of the 4 machines 2018. From there the machine learning work can start.
Tooling up
As well as programmers, laptops and coffee we were delighted to welcome Mark Pipe a data scientist from the Hartree Centre to provide us with guidance.
Technical weapons of choice for running machine learning experiments are largely ‘R’ and ‘Python’ and we chose to use Python as this sits well with our software engineering skills. We had all downloaded Anaconda to give us a toolkit and most people worked in Jupyter Studio which for those not familiar provides an interactive notebook environment for putting experiments together in interpreted Python. We also had a look at Microsoft Azure of which more later.
Preparing the data
First thing to do is to get the data loaded and prepped and make some decisions perhaps about which columns of data to use or ignore. In Python you need to get the file into a Pandas DataFrame and then the manipulation can happen. Various folk around the table tried graphing features of the dataset, looking really for correlations between production speed achieved and the input factors.
For machine learning, the base approach is to split the data into two sets, a large set for training and a smaller test set, the later kept secret from the training algorithm. To keep score we have ‘Explained Variance’ that tells us how good our machine learnt algorithm based on the training data is at predicting the test data. This is a ‘goodness of fit’ measure of how well we did although gallons of virtual ink are, apparently, spilled over the nuance of this. Purists will be horrified at how I have simplified the idea but for this occasion the nearer 1 your variance score is the more of a winner you are.
Hit the Machine Learning Button
With the data prepared we then had a look at Machine Learning. As far as we are concerned here this involves using 80% of the data to train an algorithm to link the input features, for example paper thickness, number of pages, total batch size, to the speed of production. Once the data has been prepared the Python libraries step in to do the hard mathematical crunching to train the model. A range of algorithms are available, it is generally a one line piece of code to fire them off once you have got this far. So you don’t need to have a data science PHD to run an algorithm, even if you need to be a hard core mathematician to write one, we all managed it. Like a good board game perhaps a moment to learn a lifetime to master. Luckily with Mike from Hartree on hand making suggestions we were able to keep errant software engineers on the data science straight and narrow.
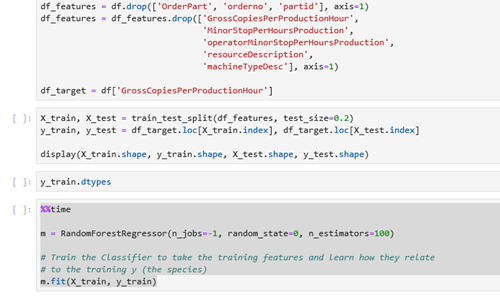
Personally, I had a go at 2 models, a regression model and a somewhat more esoteric ‘random forest’ model. Alas for the columns of data I had chosen neither of these gave a good ‘Explained Variance’. Certainly not enough to meet a useful business objective yet.
Business Objective
So the tools for machine learning are now around and pretty much cheap as chips what use can they be put to. Lots of examples widely discussed tend to be some kind of ECommerce based examples or driving cars. For the ECommerce examples there are some great use cases, you can crunch your data to find out what signals ‘a client up for a special offer’, plug this into for example the Azure Machine Learning tools and it will give an answer to your eCommerce platform on the fly and you can spit out a discount voucher.
But at Village we tend to be more involved in Internet of things, shop floor data collection, ticket printing, retail business intelligence. I tend to get excited at discovering connections between planning, production, forecasting that type of thing. I don’t get invited to many parties of course but this is why we were looking here at whether we can provide some predictive assistance to factory planners, or identify unnoticed causes of problems in production. A real win would be if we can predict the speed as well as the human plan (noting a prediction and a plan are not the same thing), we could assist in spotting how likely there is to be a variance from the plan. This is what I think might excite devotes of Six Sigma, keeping stuff predictable.
What We Gained
I think for our team proving that they could programme through from data to Machine Learning Algorithm means the process is demystified. The trick though is for us to spot opportunities for these tools for our clients. Involving a few more than our senior BI team means we have more eyes on this opportunity.
It is one thing to run an experiment such as we did last week, another perhaps to have a regular reliable system. This is really where our data manipulation skills come in as not only do people want an answer but they want it reliably and before hell freezes over, proper engineering discipline and skill required for this, you can’t just rock up with a Udacity course (other e-learning platforms are available but one of our clients owns this one) under your belt and do this.
What About the Cloud
To bring 2 hot topics together is to think of Machine Learning in the cloud, well for this exercise Dom our senior BI Analyst thought he would tackle it using the Azure BI facilities, this easily let him work in Jupyter notebook as other people were doing. It also offers Azure Machine Learning Studio which gives a code free interface. This platform offers an opportunity to experiment and deploy in the cloud providing a secure and acceptable platform for clients to work with. I think this will be a key platform for us, especially integrating with our existing Azure and Power BI work.
The People
Ultimately as a company we are a place where talented people choose to spend their days and careers and we employ people who are naturally interested in what technology can do and bringing that technology to solve our clients problems. The time for Machine Learning to join our tool box has come. So the team enjoyed workshopping this problem. We’re thankful to the data owner and our guests, I’ll leave the last word to Mark from Hartree.
I really enjoyed working on this interesting data problem with a really creative and enthusiastic group from Village Software. It was great to be able to use my Hartree Centre experience and expertise to develop the team’s data science capabilities and start the company on its journey to provide even more insight to their clients using machine learning. - Mark Pipe, Hartree Centre
Posted under: Learning teach and learn events Machine Learning
Browse all tags- Share:
-


